Announcement
Adjusted Means: Adjusting For Numerical Variables
Gerard E. Dallal, Ph.D.
 Are men stronger than women?
It sure looks like it. Here are some data from a sample of healthy young
adults. The measure of strength is something called slow, right
extensor, knee peak torque. The dashed lines are drawn through the means
of the men and women at 162 and 99 ft-lbs, respectively (P < 0.001,
Student's t test for independent samples).
One might then ask the question of whether this is still true after
adjusting for the fact that men tend to be bigger than women. In other
words, ounce for ounce, are women just as strong as men? One way to
answer this question is by fitting the analysis of covariance model
strength = b0 + b1 lean body mass +
b2 SEX ,
where SEX is coded, say, 0 for women and 1 for men. [Since sex can
take on only two values, many analyst would prefer the variable name
MALE, coded 0 for women and 1 for men, in keeping with the convention
that when a variable is named after a "condition", 1 denotes the presence
of the condition and 0 denotes its absence. I tend to use variable names
like F0M1 where the name contains the codes.] We can use the fitted model
to estimate the difference in strength between men and women with the
same lean body mass. In this way, the model is said to adjust for lean
body mass,
 The fitted model is
strength = 2.17 + 2.55 lean body mass + 12.28 SEX ,
For a given amount of lean body mass, a male is predicted to be 12.28
ft-lbs stronger than a woman. However, this difference (the coefficient
for SEX in the model) is not statistically significant (P = 0.186).
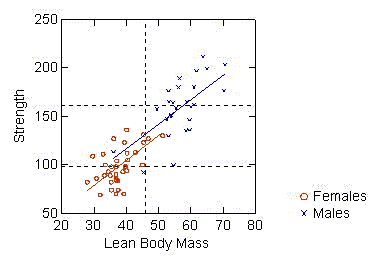
This is illustrated graphically in the scatterplot of strength against
lean body mass. Once again, the horizontal dashed lines are drawn
through the data at the mean strength values for men and women. We see
that men are stronger, but they also have a lot more lean body mass. The
red and blue lines are the model fitted to the data. The closeness of
the lines suggests that, in this regard at least, men can be thought of
as big women or women as small men.
Many investigators like to summarize the data numerically through
adjusted means, which take the differences in other variables such
as lean body mass into account. Adjusted means are nothing more than the
predicted muscle strength of men and women with a given amount of lean
body mass. Since the data are consistent with parallel lines, the
difference between men and women will be the same whatever the amount of
lean body mass. We could report predicted stength for any particular
amount of lean body mass without distorting the difference between men
and women. Standard practice is to predict muscle strength at the mean
value of lean body mass in the combined sample. Here, the mean value of
lean body mass is 45.8 kg. Thus, the adjusted mean (strength) for men is
131.3 ft-lb and 119.0 ft-lb for women. These values can be read off the
vertical axis by following the vertical line at 45.8 kg of LBM to where
it intersects the fitted regression lines.
This example illustrates everything I don't like about adjusted means.
In essence, individual adjusted means by themselves don't mean anything!
Well, they do, but they may be uninteresting or misleading. These
adjusted means arethe estimated strength of a man and woman with
45.8 kg of lean body mass. This is a lot of lean body mass for a women.
It's not a lot of lean body mass for a man. It's a value that isn't
typical for either group. Those familiar with muscle strength measures
might be distracted as they wonder why our men are so weak or women so
strong. This gets in the way of the data's message. I find it better to
report the constant difference between the two groups.
To be fair, if there is considerable overlap between the groups--that
is, if the groups would be expected to be the same with respect to
variables being adjusted for if not for the effects of sampling--adjusted
means can help bring things back into alignment. However, adjusted means
should never be reported without giving critical thought to how they
represent the data..
[back to LHSP]
Copyright © 2001 Gerard E.
Dallal
 Are men stronger than women?
It sure looks like it. Here are some data from a sample of healthy young
adults. The measure of strength is something called slow, right
extensor, knee peak torque. The dashed lines are drawn through the means
of the men and women at 162 and 99 ft-lbs, respectively (P < 0.001,
Student's t test for independent samples).
 The fitted model is