Announcement
The Model For Two-Factor Analysis of
Variance
Gerard E. Dallal, Ph.D.
[This is a rethinking of the note that precedes it, "Multi-Factor
Analysis of Variance". I expect to merge them or at least rework them in
the future. For the moment there is considerable overlap.]
- If you understand the model for two-factor analysis of
variance, you understand most of multi-factor analysis of
variance.
- If you do not understand the model for two-factor
analysis of variance, you are dangerous and should not be using the
technique!
The Model
Consider an experiment with two factors, A with a levels and B
with b levels. To avoid distractions, let the study be
balanced, that is, have the same number of observations at each
of the ab combinations of factor levels,
(1)
Let's start with a really simple model:
E(Yijk) = 
It can't get any simpler than that! Every combination of
A and B has the same expected value.
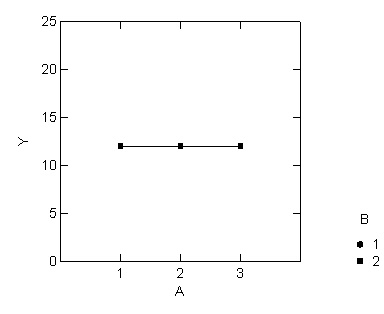
Let's make it a little more real by drawing a picture.
- Let a=3 and b=2.
- Let the vertical axis represent the
response Y.
- Let the horizontal axis represent the levels of factor A,
and
- Let's draw a line for each level of B.
- Let's assume the
common (also mean) value is 12.

- Every combination of A & B has an expected response of 12.
- It
looks like there is one line because the lines for the two lines
representing the two levels of B are lying on top of each other.
- The
two lines lie on top of each other because the expected response does not
change with the level of B.
- The line is horizontal because the
expected values do not change with the levels of A.
(2)
Let's make the model a little more interesting by adding an A
effect
E(Yijk) =  +
+
 i
with
  1 =
-6,
 2 = 5, and
 1 = 1.
It says that the expected response depends only on the level of factor
A.
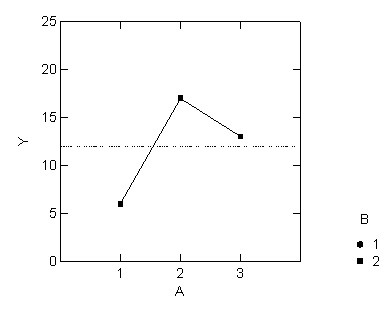
Let's drawing a picture here, too.

- There are still two lines.
- The lines are not horizontal
because the expected response differs according to the level of A.
- However, since the expected response does not depend on the level of
B, the lines still lie on top of each other.
- Since the model is
constrained to have

 i = 0, the
  's represent the vertical distance
between each group mean and the overall mean.
(3)
Now, let's suppose there is only a B effect
E(Yijk) =  +
+
 j
with
  1 = 3 and
 j = -3.
and here's the picture

- Now, both lines can be seen.
- Since the expected response does
not change with the level of A, the lines are horizontal.
- However,
since the expected response depends on the level of B, the lines no
longer lie on top of each other.
- Since the model is constrained to have

 i = 0, the
  's represent the vertical distance between each group
mean and the overall mean.
(4)
Now, let's add the A and B effects together. Here's the model
E(Yijk) =  +
+
 i +
i +  j
j
The model is said to be additive because the effects
add...literally! To get the expected valued of Yijk, one
starts with the overall mean, adds the A effect, and then adds the B
effect.
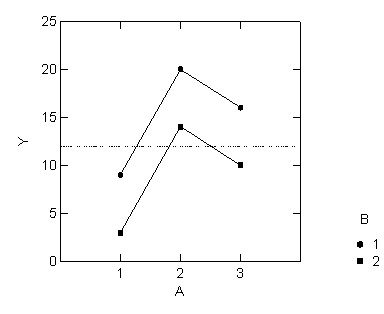
Here the picture

- There are two lines.
- Since the expected response changes with
the level of A, the lines are not horizontal.
- Since the expected
response depends on the level of B, the lines do not lie on top of each
other.
- The lines MUST be parallel!
- When moving from one
level of A to any other level, the model forces the expected change in
response to be the same for all levels of B.
- When moving from one
level of B to any other level, the model forces the expected change in
response to be the same for all levels of A
(5)
Now, let's complete the model by adding the interaction
E(Yijk) =  +
+  i +
i +  j + (
j + (
 )ij
)ij
Here it comes! One of the two most important things you'll
learn about fitting multi-factorial ANOVA models:
THE INTERACTION MEASURES THE EXTENT TO
WHICH
A MODEL IS NOT ADDITIVE!
When the data are analyzed in the usual manner, the software output
typically begins with an ANOVA table containing four lines: A, B, AB,
and error. The first three test specific hypotheses:
- A:
 1 = ... =
  a (= 0)
- B:
 1 =
... =
  b (= 0)
- AB: (

 )11 = ... = (
 )ab (= 0)
(= 0) is in parentheses because it is already implied by the constraints
on the parameters, in the case of A:, for example, by having 
 i = 0.
Here comes the second important thing you need to know
about fitting multi-factorial ANOVA models:
The first hypothesis, A:, (often called the main effect of
factor A) looks at the mean response for each level of A--that is,
the mean obtained by averaging over all levels of B--and asking whether
they are the same. This is true whether or not there is an interaction
in the underlying model!
The second hypothesis, B:, looks at the mean response for each level of
B--that is, the mean obtained by averaging over all levels of A--and
asks whether they are the same. This is true whether or not there is
an interaction in the underlying model!
As already noted, the third hypothesis, AB:, which looks for
interaction, test for whether the model is additive.
If the model is additive, hypothesis A: (and B:) make perfect
sense.
- If the model is additive, the means for the levels of
factor A will behave like the expected values from any of the individual
levels of B. That is, if for every level of B, the expected response for
level 1 of factor A is 4 units higher than for level 2 of factor A, the
mean response for level 1 of factor A averaged aver all levels of B is 4
units higher than for level 2 of factor A.
- In addition, if a line
connecting the means for each level of factor A were added to the final
figure above it would be parallel to the individual lines already
there.
If the model is not additive, the interpretation of A: does not
change! It still asks whether the means obtained from each level of A
by averaging over all levels of B are the same. However, if the model
is not additive, this hypothesis might not be useful, as the following
figures demonstrate

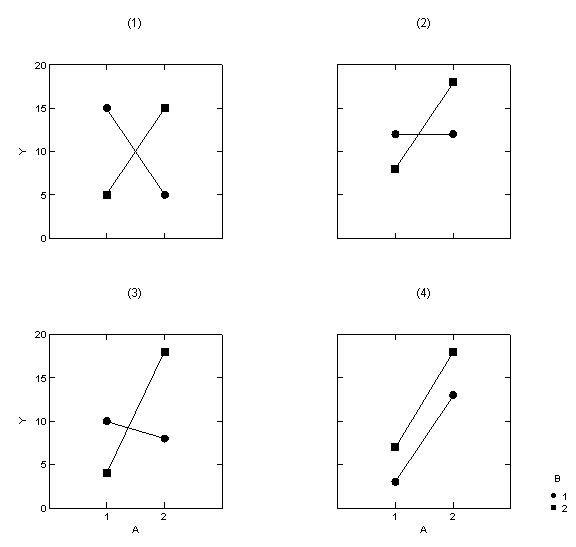
For the purposes of discussion, assume that random variation is
minimal, that is, that it is small enough that everything you see in the
pictures is real and statistically significant. Since none of the lines
are parallel, interaction is present in every figure. Also, assume that
large values of Y are good.
- Since the means of the two levels of A are equal, the main effect
of A is 0. Yet, it would be a huge mistake to say that A doesn't matter.
Suppose B1 (circles) were males and B2 (squares) were females. The men
would benefit most from A1, while the women would benefit most from A2.
Never interpret main effects in the presence of interactions!
- Since the mean of A2 is higher than the mean of A1, there is a main
effect of factor A, with A2 being better than A1. Yet, men should be
indifferent to what they get because, for them, the expected response on
A1 is the same as on A2. If A2 were very expensive compared to A1, it
might make sense to give A2 to women, but why spend the additional money
giving it to men? Never interpret main effects in the presence of
interactions!
- This one is like (2). The mean of A2 is higher than the mean of A1,
so there is a main effect of factor A, with A2 being better than A1. Yet,
men do better on A1. They would want the one that's best for them, not
the one that's best overall. Never interpret main effects in the
presence of interactions!
- Here there is a main effect of A. The overall mean of A1 differs
from that of A2, with A2 being greater. There is also an interaction.
The difference between men and women is greater for A2. However, the
interaction is not so great that the gross findings of the main effect
(A2 better than A1) is distorted. Some might say, Be careful
interpreting main effects in the presence of interactions! However,
I prefer "Never interpret main effects in the presence of
interactions!" in the sense that "When interactions are present,
never interpret main effects without taking the interactions into
account!"
So, what's the problem?
Virtually every statistical software package displays its output
starting with main effects followed successively more complicated
interactions, that is, first come main effects, then the two-factor
interactions, then the three-factor interactions, and so on. However, as
we've just seen the evaluation of a multi-factor analysis of variance
should proceed in the opposite order, that is, by first looking at the
most complicated interaction and, if it can be dismissed, by successively
less complicated interactions.
I'm not sure if the reason some investigators focus on main effects is
that main effects appear earlier in the ANOVA table or that the
investigators find interactions too difficult to understand and deal
with. However, one of the most common disastrous mistakes I see is
interpreting main effects without taking interactions into account as
though the interactions don't matter. This tells me that many people who
use analysis of variance do not understand main effects or the underlying
model that produces them. Hence, this note.
[back to LHSP]
Copyright © 2006 Gerard E.
Dallal


 +
+
 i
i  1 =
-6,
 2 = 5, and
 1 = 1.


 i = 0, the
  's represent the vertical distance
between each group mean and the overall mean.
 +
+
 j
j  1 = 3 and
 j = -3.


 i = 0, the
  's represent the vertical distance between each group
mean and the overall mean.
 +
+
 i +
i +  j
j 
 +
+  i +
i +  j + (
j + (
 )ij
)ij 1 = ... =
  a (= 0)
 1 =
... =
  b (= 0)

 )11 = ... = (
 )ab (= 0)
 i = 0.
